

Steve Barton – Technical Analysis for Beginners
We are going to take the fear out of buying and selling stocks. You will feel relaxed buying and selling.
I am Steve Barton, and these are my Must-Know Patterns and Indicators. You get over 3 hours of video instruction. This is your no-nonsense, beginner-friendly guide to reading charts, spotting winning setups, and understanding the real mechanics behind price movement—without drowning in complicated jargon.
This isn’t just another online trading course. It’s clear, conversational, and practical, designed for everyday people who want to take control of their investments and start making smart, informed decisions. When to buy, and when to sell.
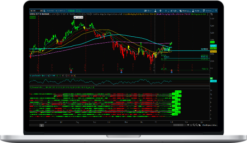
You will start with a Free Version of TradingView, the Charting Software we will use in this series. I show you exactly how to set up your chart – mouse click by mouse click so it looks exactly like mine.
What You’ll Learn In Technical Analysis for Beginners
The Core Foundations: Learn how to read price action, use moving averages, and interpret the RSI and MACD like a pro.
Chart Patterns That Work:
- Double Bottoms: Spot powerful reversal setups and time your entries.
- Cup & Handle: Discover a rare but highly reliable pattern that could signal major breakouts.
- Bull & Bear Flags: Learn to ride the momentum like seasoned traders do.
- Fibonacci Levels: Use nature’s math to identify key turning points in the market.
More courses from the same author: Steve Barton
Related products

Stock Trading
Stock Trading

»Instant Delivery

Forex Trading

Stock Trading
Stock Trading

Stock Trading