

Candle Charts – Swing Trading 1
Discover how to profit from natural market cycles and trends in ANY time frame
We’ll crush the myth that a swing trade lasts from just 1-3 days. You’ll see that it has more to do with the natural ebbs and flows (cycles) and how they progress in a certain way.
Whether you already know about swing trading, or this is your first introduction, we’ll walk you through everything you need to know for success.
- The Essence of Technical Analysis – Learn the right holding period and chart correlation
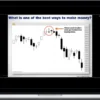
- What is Swing Trading? – See how to pinpoint precise entry and exits into and out of any instrument for the duration of a single run in a trend in any time frame
- Why Swing Trading Works – When you trade in the direction of the trend, you boost your probability of success
What You’ll Learn In Swing Trading 1
- Market condition analysis to understand the environment
- Precision entries & exits using Nison candle patterns
- Use indicators to confirm energy behind price action
- Find the best trend line patterns for swing trading
More courses from the same author: Candle Charts
Related products
-91%
Stock Trading
Original price was: $297.00.$27.00Current price is: $27.00.
-95%

Original price was: $147.00.$7.00Current price is: $7.00.
-86%

Stock Trading
Original price was: $497.00.$69.00Current price is: $69.00.
-85%

Original price was: $497.00.$75.00Current price is: $75.00.
-72%

Stock Trading
Original price was: $200.00.$57.00Current price is: $57.00.
-94%

Stock Trading
Original price was: $450.00.$27.00Current price is: $27.00.
-95%
Original price was: $197.00.$9.00Current price is: $9.00.
-95%

Original price was: $197.00.$9.00Current price is: $9.00.