
Fibozachi – Super RSI™
Original price was: $295.00.$162.00Current price is: $162.00.
Delivery: Within 7 days
Fibozachi – Super RSI™
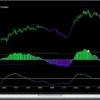
The RSI (Relative Strength Index) is one of the most popular technical indicators used by novice and professional traders alike. It does have one major problem though — the regular version of the RSI hasn’t been updated or improved upon since it was first created by Welles Wilder back in 1978!
Though the RSI used to be a great trading indicator, the lack of any updates has made it less effective in today’s dynamic, fast-paced markets. As markets evolve, the technical indicators that we rely on to trade successfully must also evolve. Our Super RSI™ Indicator Package overcomes the limitations of the old RSI and offers several powerful new features — making it more effective than ever before!
- Adapted for modern markets, the Super RSI™ provides new capabilities and more effective ways to use the RSI
- Includes 5 unique color-coding methods, price/data smoothing, gapless technology, and our state-of-the-art “Divergence Engine”
- “Dynamic OverBought/OverSold Levels” (DOBOS™) automatically adjusts after each bar — keeping you in perfect harmony with price at all times.
What You’ll Learn In Super RSI™
Special “Scanner” Indicator & Workspace for All Platforms
The Super RSI™ Indicator Package also includes a special “Scanner” Indicator designed to scan for signals and trend conditions using the NinjaTrader Market Analyzer, TradeStation RadarScreen or MultiCharts Market Scanner. And all columns, colors, and text are fully customizable!
State-of-the-Art “Divergence Engine”
The Super DMI™ includes a special “Divergence Engine” unlike anything you have seen before. It is trader-friendly, easy to use, and offers many advanced features, settings, and customizations — making it ideal for both novice and professional traders.
Issues Various Divergence Signals and Alerts
Our Divergence Engine issues standard divergences, “Filtered Divergences” and 3-Point Divergences! There are also customizable audio, visual, and email alerts to alert you to each divergence signal!
“Dynamic OverBought/OverSold Levels” (DOBOS™)
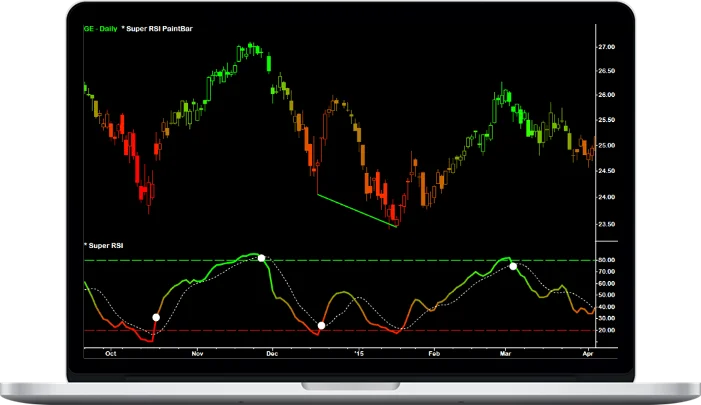
The Super RSI™ utilizes an innovative and proprietary new feature called DOBOS™, which stands for “Dynamic OverBought/OverSold Levels”. Instead of relying on fixed or static OB/OS Levels like “80” and “20”, DOBOS™ automatically adjusts after each bar — keeping you in perfect harmony with price at all times. This is a significantly more accurate and effective method of determining the OverBought and OverSold Levels of an Indicator. Furthermore, the DOBOS™ Reversal Signals are some of the most powerful and accurate of all signals.
Plots a Smoother RSI by using Smoothed Price Data
Only the Super RSI™ lets you smooth the price data that flows into the RSI formula. By smoothing price data, the plot of the Super RSI™ becomes much smoother than the jagged plot of the original RSI.
RSI Bollinger Bands offer a New Perspective
The Super RSI™ has optional “Bollinger Bands” that are based on the values of the RSI instead of price — giving you access to an enhanced and unique perspective of the RSI!
“Gapless Technology” Allows the RSI to Ignore Price Gaps
At a setting of “0”, all price gaps will be included when calculating the RSI.
At a setting of “1”, all price gaps will be excluded when calculating the RSI.
Customizable Alerts for Crossovers, Reversals and Divergences
You can easily activate or deactivate each of the various to prevent being distracted by signals that you aren’t trading.
Numerous Color-Coding Options
- Gradient Color-Coding
- OB/OS Color-Coding
- MidLine Color-Coding
- RSI Avg. Color-Coding
- Slope Color-Coding
More courses from the same author: Fibozachi
Related products


Forex Trading

Forex Trading


Forex Trading

Forex Trading

Forex Trading